How to Read a Gold Price Chart: A Practical Guide for Buyers
Our gold price chart moves with the market, but a rising or falling line tells you little unless you know what it measures and over what period. This guide shows you how to choose a timeframe, spot a trend, read highs and lows, work out percentage change and avoid common mistakes.
Whether you are pricing a wedding set or saving in small bars, the chart shows where today’s price sits against recent months: a picture of the recent past, not a forecast.
What our chart shows
The chart sits on our live UAE gold prices page, in the “Daily gold & oil technical signals” section, where you can switch between gold, Brent and WTI crude. Time runs along the bottom in UAE time; the vertical axis is US dollars per troy ounce (31.1035 grams of pure gold), before making charges, VAT and the dealer’s margin.
Gold is trading at about 4,072.10 dollars an ounce right now. Because the dirham (3.6725) and the Saudi riyal (3.75) are pegged to the dollar, any percentage move on the chart applies almost exactly to the local gram price.
Pick the right timeframe
The five ranges differ in detail as well as length: points are minutes apart on 1D but a week apart on 5Y.
| Range | Gap between points | Best for |
|---|---|---|
| 1D | A few minutes | Spotting a jump just before you buy |
| 5D | Under an hour | Reactions to this week’s news |
| 1M | One to two hours | The recent range, if buying within weeks |
| 1Y | One day | The broad trend |
| 5Y | One week | The long view |
Start wide and zoom in: the year for the big picture, the month to see where today fits, and the day only if you are about to buy.
Line or candlestick?
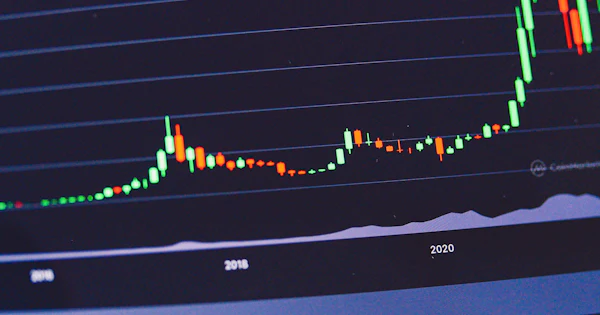
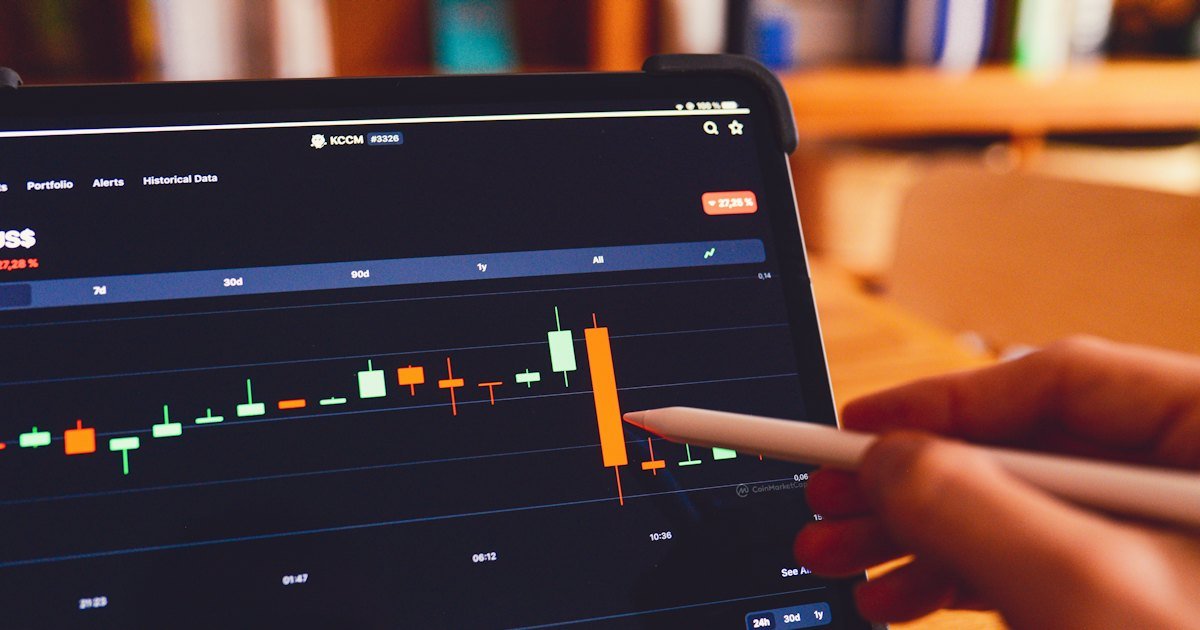
Ours is a line chart, the clearest way to see direction. Trading platforms often use candlesticks, where each candle sums up one period with four prices: open, high, low and close. The body runs from open to close, thin wicks reach the high and the low, and the body is usually green if the price closed higher and red if it closed lower, though colours vary.
For example, a daily candle that opens at 4,000 dollars, reaches 4,060, dips to 3,970 and closes at 4,040 has a green body from 4,000 to 4,040; a line chart would usually show only the close. For jewellery and small bars, the line is normally all you need.
Reading the movement
Trend
An uptrend is a run of higher highs and higher lows, a downtrend is the reverse, and a sideways market bounces between two nearby levels. Never judge the trend from one day: a sharp drop on the 1D chart can be a ripple in a clear rise on the 1Y chart.
Highs and lows
The peak on the 1Y chart is the highest daily close plotted (on 5Y, the highest weekly price), not necessarily the highest price traded within a session, so it may sit slightly below the intraday record quoted in the news. The day’s high and low on our price board are tracked from midnight UAE time.
Percentage change, worked through
Percentage change = (latest price − first price) ÷ first price × 100. The chart’s figure compares the last point with the first point of your chosen range, so the 1D figure can differ slightly from today’s change on the price board, which is measured against the previous UAE day’s last price and now stands at +0.17%. A one-month example, with made-up round numbers:
| Reading | Calculation | Result |
|---|---|---|
| Change over the month | 4,000 to 4,100 dollars | +2.5% |
| Distance from the month’s high | 4,180 to 4,100 | −1.9% |
| Rise from the month’s low | 3,920 to 4,100 | +4.6% |
| Monthly range | 4,180 − 3,920 = 260 dollars | 6.6% of the low |
At those prices raw 21K gold comes to about 4,100 ÷ 31.1035 × 3.6725 × 0.875 ≈ 423.6 AED a gram, up from about 413.3 AED, or roughly 10 dirhams more. Your bill rises by less than 2.5%, though, if the making charge is a fixed amount per gram, as it usually is.
Why long-range history is approximate
Our live prices are spot prices, for immediate delivery, but the 1M, 1Y and 5Y history comes from published COMEX gold futures data. Futures normally trade slightly above spot, so the whole series is multiplied by one ratio that makes its last point equal to today’s spot price.
This re-basing keeps the shape and percentage moves intact, but older points may differ a little from the spot price at the time, because the futures–spot gap shifts with interest rates and time to expiry. A note under the chart flags this; the 1D and 5D ranges usually use spot snapshots we record every five minutes. See our pricing methodology, and gold spot vs futures for a worked example.
Common mistakes
- Ignoring the scale. The axis does not start at zero, so a 1% move can look like a cliff. Read the numbers, not the slope.
- Comparing unlike charts. Ounces and grams, dollars and other currencies, or different timeframes cannot be compared directly.
- Reading the weekend as calm. Global gold trading largely stops from early Saturday to early Monday, UAE time, so a flat stretch means the market was closed.
- Chasing small swings. A 0.5% move on a 420 AED gram is about 2 dirhams, while a hypothetical making charge of 30 AED a gram equals a move of over 7%, so negotiating it may save you more than perfect timing.
Using the chart to plan a purchase
- Start with your need: weight, karat, budget and date. The chart will not move the wedding.
- Check the 1Y and 1M charts to see whether today’s price is near the top or the bottom of its recent range; the gold mood gauge on our home page does this over 7 to 120 days.
- If you have a target price, set a price alert on the site instead of watching the screen.
- Some savers spread purchases over several weeks or months so their average cost is not tied to one moment: a common approach, not a guarantee.
- On the day, compare the shop’s gram rate with our live price to see what is being added.
This is general information, not financial advice or a recommendation to buy or sell. For the RSI, support and resistance figures, see gold technical indicators explained.
Frequently asked questions
Which timeframe suits someone buying jewellery?
Usually 1M, which shows the recent range without minute-by-minute noise; 1Y adds context for a bigger purchase such as a full wedding set.
Why does your chart differ slightly from another platform’s?
It may show a futures contract rather than spot, close the day at a different time, or use candles. Our long-range history is also re-based to today’s spot price.
Can a chart tell me when the price will rise or fall?
No. It puts today’s price in context but cannot reveal the future; an interest-rate decision or a surprise headline can change direction within hours.
Use the chart to understand the price, not to chase it.